Common Chart Patterns
Chapters
What are chart patterns?
Chart patterns are the foundational building blocks of technical analysis. They keep appearing in the market in the same way over and over again, and it is not difficult to recognize them. Scalpers, day traders, swing traders, position traders, and investors may all make use of these fundamental patterns since they occur on all timeframes and can be utilized to make trading decisions. There are three different types of patterns that can be classified according to how the price is likely to behave after the completion of the pattern: reversal patterns, in which the price is likely to reverse, continuation patterns, in which the price is likely to continue its course, and bilateral patterns, in which the price can go either way, depending on whether it breaks to the upside or to the downside.
If you’re not familiar with reading candlestick charts, start by checking out our guide – What Is A Candlestick Chart?
Charts provide a historical perspective on how prices have changed over time. By looking at the past behavior of an asset’s price, one might potentially identify patterns that are likely to reoccur in the future. In the stock, forex, and cryptocurrency markets, many traders will attempt to capitalize on the fact that candlestick patterns have the ability to communicate a meaningful narrative about the underlying asset being charted.
In this article, we will take a look at some of the most well-known patterns that are currently available; many traders consider these patterns to be solid trading indicators. Using the measures of the chart pattern, one may make a projection for the subsequent price movement and determine what the objective should be. Because these patterns may be traded in either an aggressive manner (requiring less conformity) or a cautious manner (requiring more conformance), the rules of entry and exit can be flexible.
Flags
A consolidation pattern known as a flag occurs after a significant price movement and moves in the opposite direction of the trend that has been seen over a longer period of time. It seems as if a flag is being displayed on a flagpole, with the pole representing the impulsive move and the flag representing the area of consolidation.
It is possible to employ flags in order to determine whether or not the trend will continue. Additionally significant is the loudness that accompanies the pattern. The ideal scenario calls for the impulse move to occur at high volume, whereas the consolidation phase should have lower volume that gradually decreases.
Bull flag
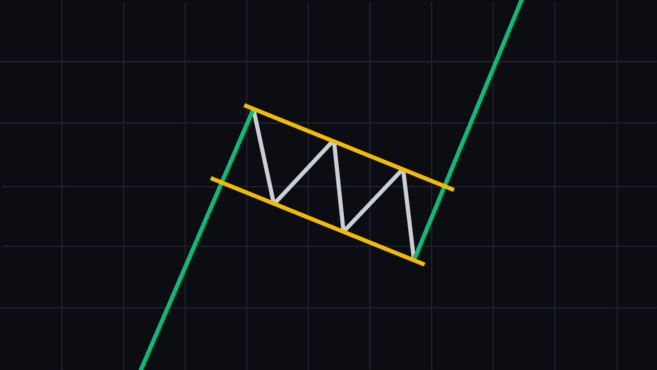
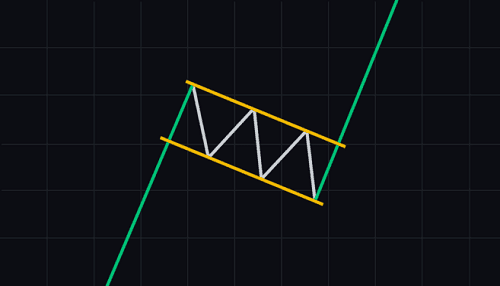
The bull flag happens in an uptrend, follows a sharp move up, and it’s typically followed by continuation further to the upside.
Bear flag
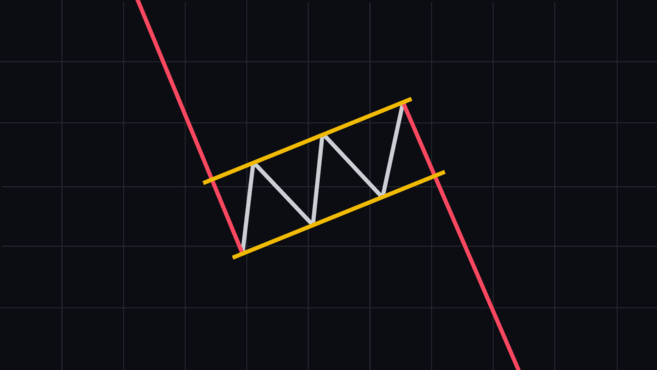
The bear flag happens in a downtrend, follows a sharp move down, and it’s typically followed by continuation further to the downside.
Pennant
Triangles
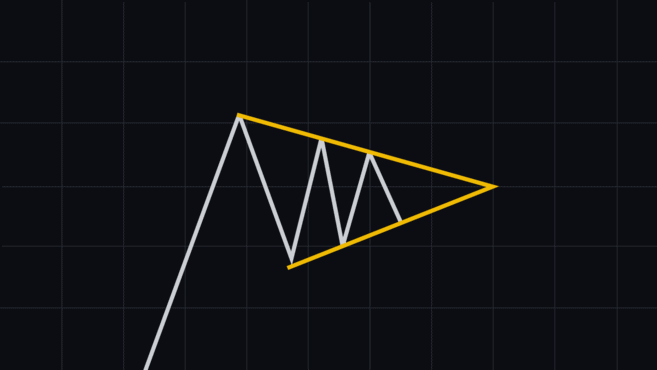
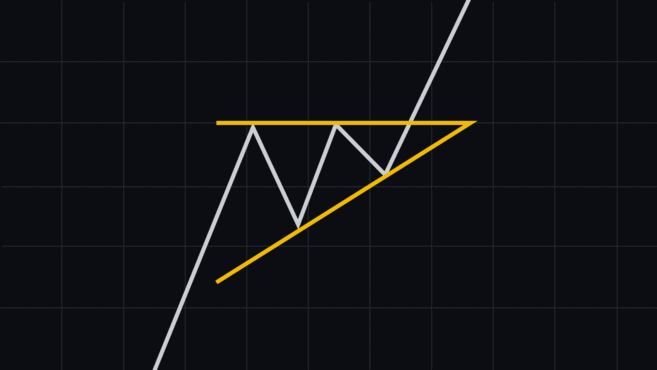
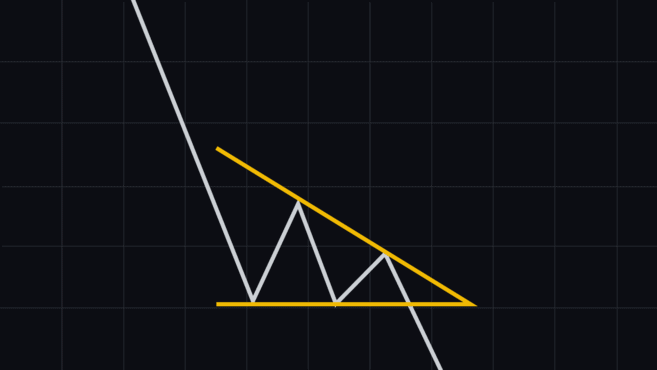
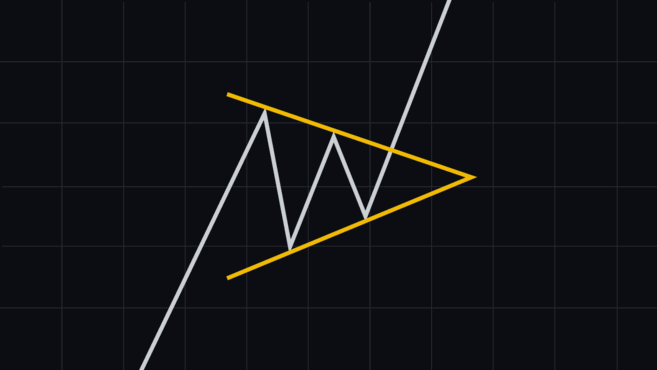
A triangle is a kind of chart pattern that is distinguished by a price range that is gradually moving toward one another and is generally followed by the trend’s continuance. The triangle itself illustrates a temporary halt in the primary trend, but it may point to either a reversal or a continuation of the trend.
Ascending triangle
Descending triangle
Symmetrical triangle
Wedges
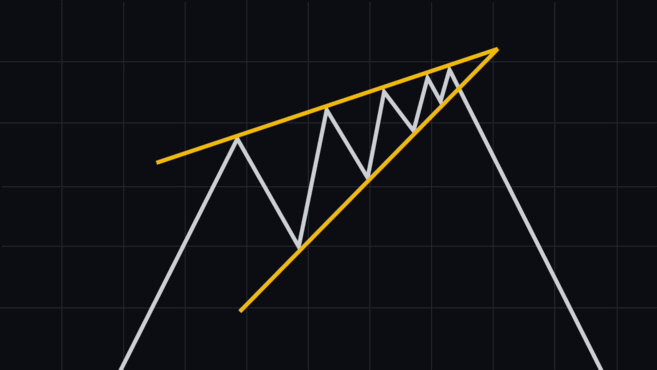
It might be an indication that a trend reversal is about to occur, given that the underlying trend is weakening. A declining volume may accompany the formation of a wedge pattern, which is another indication that the trend may be losing some of its steam.
Rising wedge
Falling wedge
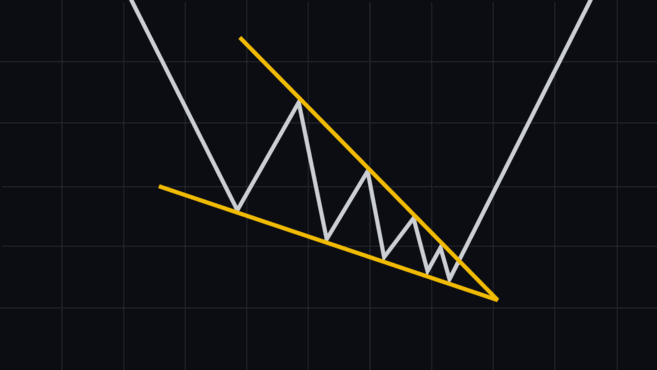
The falling wedge is a bullish reversal pattern. It indicates that tension is building up as price drops and the trend lines are tightening. A falling wedge often leads to a breakout to the upside with an impulse move.
Double top and double bottom
The formation of patterns known as double tops and double bottoms may take place if the market moves in the shape of a “M” or a “W.” It is important to note that these patterns may still be accurate even if the relevant price points are not precisely the same as each other but are somewhat near to one another.
In most cases, the volume around the pattern’s two low or high points ought to be greater than the volume surrounding the remainder of the pattern.
Double top
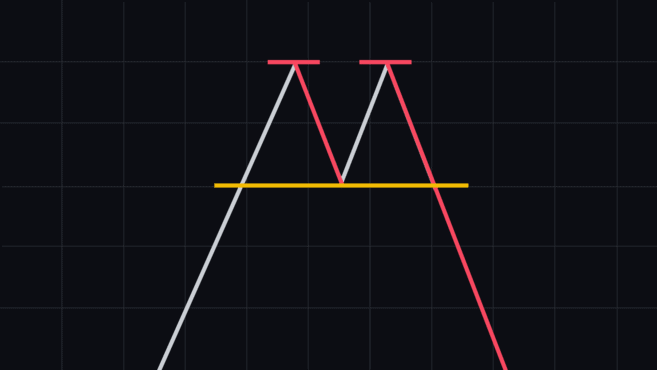
The double top is a bearish reversal pattern that occurs when the price achieves a high for the second time in a row, but it is unable to continue rising after reaching that high. At the same time, there ought to be just a minor amount of retreat between the two peaks. When the price drops below the low of the pullback that occurred in between the two peaks, the pattern is considered to be validated.
Double bottom
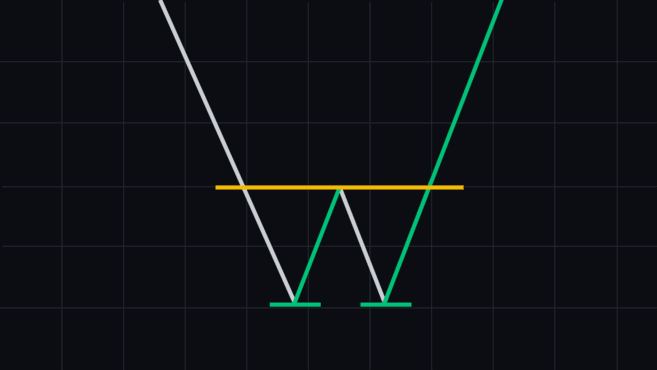
A price formation known as a double bottom is a bullish reversal pattern that occurs when the price sustains a low price level twice before moving on to a higher high. In a manner similar to that of the double top, the bounce between the two lows need to be mild. When the price achieves a higher high than the peak of the bounce that occurred between the two lows, the pattern is considered to have been confirmed.
Head and shoulders
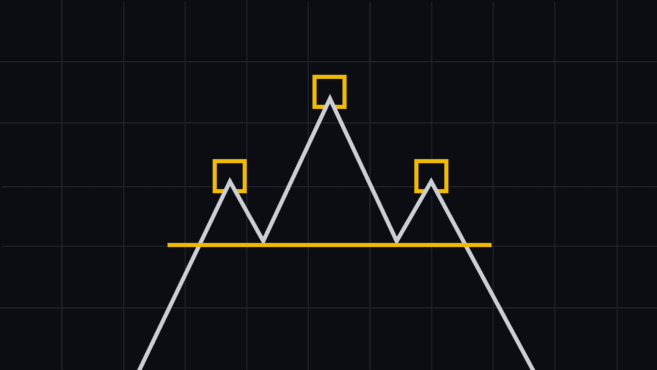
A bearish reversal pattern known as the head and shoulders consists of a baseline, also known as the neckline, and three peaks. The two peaks on the side should be nearly at the same price level as the peak in the centre, but the peak in the middle should be higher than the other two. As soon as the price breaks through the support at the neckline, the pattern is confirmed.
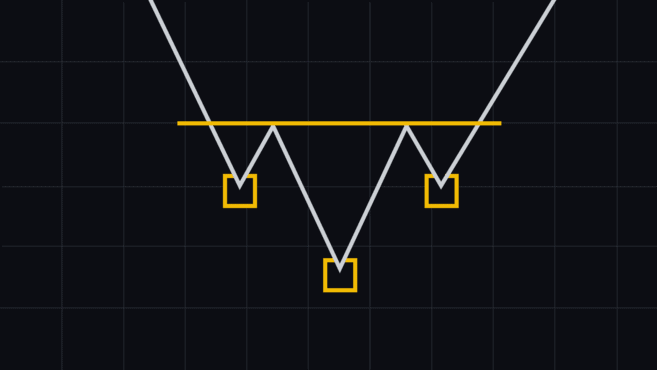
Inverse head and shoulders
