What Is the RSI Indicator?

The Relative Strength Index Indicator
In its most basic form, technical analysis (TA) is the process of looking back at past market activity in order to make projections about future price movements and patterns in the market. The majority of traders in conventional and cryptocurrency markets depend on specialized tools to do these evaluations, and the relative strength index (RSI) is one of such tools.
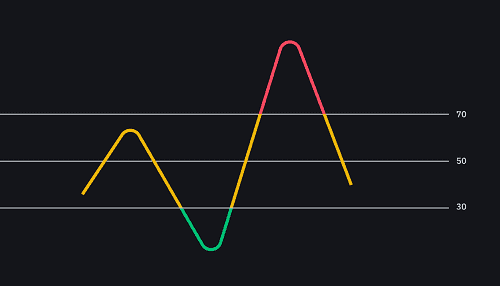
The Relative Strength Index (RSI) is a technical analysis indicator that was established in the late 1970s as a tool that traders could use to assess how a company is doing over a given length of time. It was named after its initials, which stand for “relative strength,” and “index.” It is essentially an oscillator that monitors the magnitude of price fluctuations in addition to the speed (velocity) of these movements. In other words, it is a momentum oscillator. Depending on the trader profile and the way they set up their trades, the relative strength index (RSI) may be a highly useful instrument.
In 1978, J. Welles Wilder came up with the idea for the indicator known as the Relative Strength Index. Along with other TA indicators, including as the Parabolic SAR, the Average True Range (ATR), and the Average Directional Index, it was published in his book New Concepts in Technical Trading Systems (ADX).
Wilder’s professional background includes working as a mechanical engineer and a real estate developer before he became a technical analyst. He got his start in the stock market about 1972 but didn’t have much luck with it. A few years later, Wilder put all of his previous trading knowledge and expertise into mathematical formulas and indicators. These formulas and indications were eventually used by a large number of traders all over the globe. The book was written and published in a just six months, and despite the fact that it was written in the 1970s, many chartists and traders continue to use it as a reference today.
How does the RSI indicator work?
By default, the Relative Strength Index (RSI) calculates the percentage change in price over a period of 14 periods (14 days on daily charts, 14 hours on hourly charts, and so on). The formula takes the average gain that the price has had over that period of time and divides it by the average loss that it has experienced. The results are then shown on a scale that ranges from 0 to 100.
The Relative Strength Index (RSI) is an example of a momentum indicator, which is a form of technical trading tool that monitors the pace at which the price (or data) is moving. As was previously said, the RSI is a momentum indicator. It is an indication that aggressive buying is taking place in the market when momentum is increasing and the price is rising at the same time. If there is an increase in momentum moving in the opposite direction, this is an indication that there is an increase in the amount of selling pressure.
The Relative Strength Index (RSI) is an oscillating indicator that traders may use to better recognize when market conditions have become overbought or oversold. Taking into account the 14 time periods, it assigns a value on a scale ranging from 0 to 100 to the asset price. If the RSI score is 30 or below, it indicates that the price of the asset is probably close to its all-time high (overbought). However, if the score is over 70, it shows that the price of the asset is probably close its all-time low (oversold) for that period.
Despite the fact that the standard settings for the RSI are 14 periods, traders have the option to alter it in order to either enhance sensitivity (by using fewer periods) or reduce sensitivity (by using more periods) (more periods). Therefore, an RSI that analyzes just the last seven days is more sensitive to changes in price than one that looks at the past 21 days. In addition, the RSI indicator for short-term trading setups may be adjusted to regard levels of 20 and 80 as oversold and overbought respectively (instead of levels of 30 and 70), which makes it less prone to produce misleading signals.
How to use RSI based on divergences
In addition to the RSI scores of 30 and 70, which may indicate potentially oversold and overbought market conditions, traders use the RSI to try to forecast trend reversals or to spot levels of support and resistance. The RSI scores of 30 and 70 can be found here. A strategy like this one is founded on the so-called bullish and bearish divergences in the market.
When the price of an asset and its RSI score move in opposing directions, this creates a circumstance known as a bullish divergence. As a result, the RSI score goes up, which results in greater lows, while the price goes down, which results in lower lows. This is what’s known as a “bullish” divergence, and it shows that the purchasing pressure is becoming greater despite the fact that prices are going in the other direction.
Bearish divergences, on the other hand, might be an indication that the market is losing momentum despite their being an increase in price. Because of this, the RSI score goes down, which results in lower highs, whereas a rise in the asset price results in greater highs.
It is important to keep in mind, however, that RSI divergences are not nearly as dependable when there are significant market movements. This indicates that a strong downward trend may display a number of bullish divergences before the bottom is really achieved. Because of this, RSI divergences work best in markets that have lower levels of volatility (with sideways movements or subtle trends).
Closing thoughts
When making use of the Relative Strength Index indicator, there are a number of essential aspects to take into consideration, including the settings, the score (30 and 70), and the bullish and bearish divergences. However, one must always bear in mind that no technical signal is 100% accurate, particularly if it is utilized on its own. This is especially important to keep in mind while trading. Traders might consider utilizing the Relative Strength Index (RSI) indicator in conjunction with other indicators in order to avoid following misleading signals.


