Common Candlestick Patterns

If you’re not familiar with reading candlestick charts, start by checking out our guide – What Is A Candlestick Chart?
How to use candlestick patterns
Candlestick patterns come in an almost infinite variety, and traders may utilize these patterns to zero down on interesting parts of a chart. Trading for the day, swing trading, and even position trading over a longer period of time are all options with these. Some candlestick patterns have the potential to give insights into the equilibrium between buyers and sellers, while others have the potential to signify a reversal, continuance, or hesitation in the market.
It is essential to keep in mind that candlestick patterns in and of itself do not always constitute a buy or sell indication. Instead, they are a method for analyzing the structure of the market and a possible precursor to an opportunity that will soon arise. As a result of this, it is always beneficial to look at patterns within their respective contexts. This may be the context of the technical pattern on the chart, but it might also be the atmosphere of the market as a whole or other elements.
In a nutshell, similar to any other kind of market analysis tool, candlestick patterns are most effective when used in conjunction with other strategies.
Bullish Reversal Patterns
Hammer
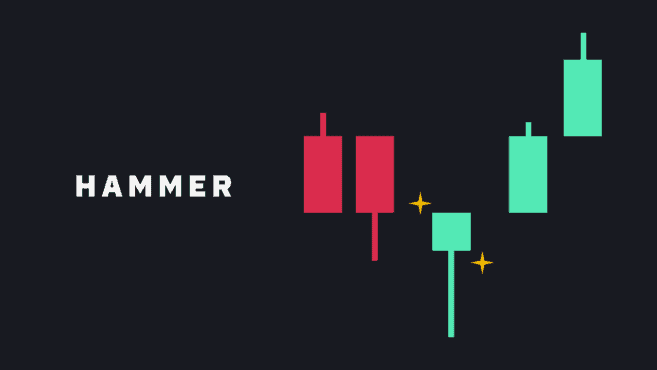
A candlestick pattern that forms at the bottom of a downward trend and consists of a lengthy lower wick that is at least twice as large as the body of the candle.
The formation of a hammer indicates that even though there was significant selling pressure, buyers were able to push the price closer to its opening level. Hammers may appear either red or green, with green hammers perhaps indicating a more robust bull response than red hammers.
Inverted hammer
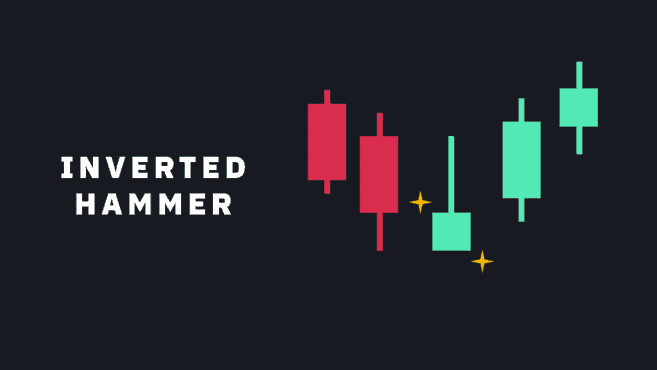
It’s exactly the same as a hammer, except the long wick is placed on top of the body rather than below it, therefore it’s often referred to as the inverse hammer. A hammer is an excellent analogy for the top wick, which should be at least twice as large as the body.
The formation of an inverted hammer at the bottom of a downward trend may be suggestive of an impending upward trend reversal. Even though the sellers were ultimately successful in driving the price down closer to the open, the upper wick indicates that the price has paused its ongoing downward journey. As a result, the upside-down hammer may be seen as a sign that purchasers are likely to soon assume a dominant position in the market.
Three white soldiers
The three white soldiers pattern is made up of three successive green candlesticks that all open inside the body of the preceding candle, and all close at a level that is higher than the high reached by the preceding candle.
In an ideal world, the wicks on these candlesticks shouldn’t be very long towards the bottom; if they are, this is a sign that consistent purchasing pressure is pushing up the price. It is possible to evaluate if there will be a continuation of the trend or a probable pullback by looking at the size of the candles and the length of the wicks.

Bullish harami
A bullish harami is characterized by a lengthy red candle that is followed by a shorter green candle that is completely contained inside the body of the preceding candle.
The bullish harami is a pattern that may develop over the course of two or more trading days, and it shows that the selling momentum is beginning to slow down and may be coming to an end soon.

Bearish Reversal Patterns
Hanging man
The bearish version of a hammer is called a hanging man. It is characterized by having a tiny body and an extended lower wick, and it often appears near the conclusion of an upswing.
The fact that the wick is now lower suggests that there was a significant drop in price; yet, buyers were able to regain control and push the price upward. Keeping this information in mind, the recent downward trend, which followed an extended upward trend, may serve as a signal that the bulls are in danger of losing their grip on the market in the near future.

Shooting star
A candlestick with a long upper wick, a short or nonexistent lower wick, and a little body, preferably located at the bottom, is used to construct the shooting star. The inverted hammer and the shooting star are both reversal patterns, however the shooting star is produced at the top of an uptrend.
It is an indication that the market hit a high point, but that sellers eventually grabbed control of the situation and pushed the price back down. Some investors believe it is prudent to wait for the pattern to be confirmed by the subsequent few candlesticks before acting.

Three black crows
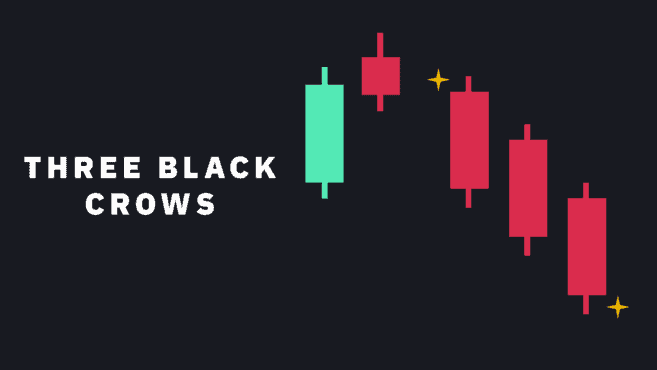
The three black crows are formed by three successive red candlesticks that open inside the body of the preceding candle and shut at a level that is lower than the low point of the preceding candle.
The same value in bearish terms of three white troops. In an ideal world, these candlesticks shouldn’t have lengthy wicks that are too high, since this would indicate that there is persistent selling pressure that is pushing the price down. It is possible to evaluate the likelihood of the activity continuing by looking at the dimensions of the candles and the length of the wicks.
Bearish harami
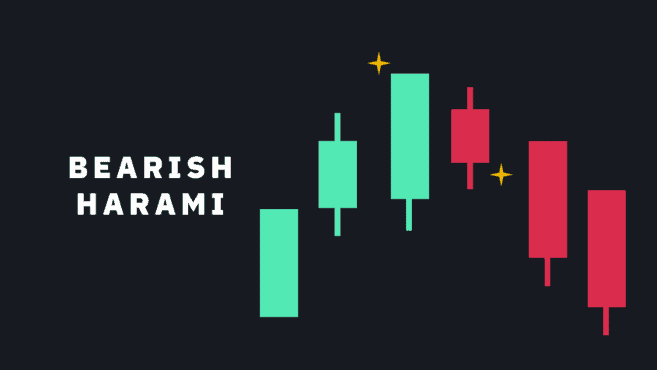
The bearish harami consists of a lengthy green candle that is followed by a little red candle that has a body that is totally contained inside the body of the candle that came before it.
The bearish harami pattern may develop over the course of two or more trading days, comes near the conclusion of an uptrend, and may be an indication that purchasing pressure is beginning to ease.
Dark cloud cover
The dark cloud cover pattern consists of a red candle that opens above the closure of the preceding green candle but then closes below the midway of that candle. This pattern occurs whenever a green candle closes above the opening point of the red candle that follows it.
It is not uncommon for it to be accompanied with strong volume, which is an indication that momentum may be moving from the upside to the negative. Traders may wait for a third red candle to form before considering the pattern to be confirmed.

Continuation Patterns
Rising three methods
When an uptrend is present, this pattern will manifest itself as three successive red candles with tiny bodies, which will then be followed by the upswing itself continuing. In an ideal scenario, the red candles shouldn’t extend beyond the range of the candlestick that came before them.
A green candle that has a huge body indicates that bulls are once again in charge of the direction that the trend is moving in, which confirms the continuance of the trend.

Falling three methods
The inverse of rising three methods, indicating the continuation of a downtrend instead.

Doji
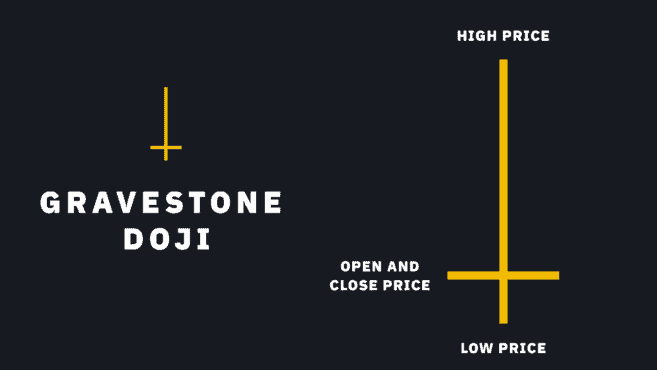
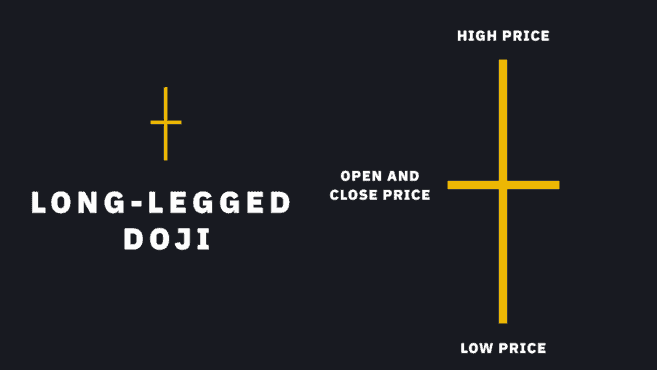
The formation of a doji occurs when the opening price and the closing price are identical (or very close to each other). Although the price may fluctuate both higher and lower than the open, it will always close at or very close to the open. As a result, a Doji may represent a moment of uncertainty between purchasing and selling pressures in the market. Despite this, the meaning of a doji is very reliant on the surrounding circumstances.
Depending on where the line of the open/close falls, a Doji can be described as:
Gravestone Doji
Long-legged Doji
Indecisive candle with both a lower and upper wick, and the open/close near the midpoint.
Dragonfly Doji
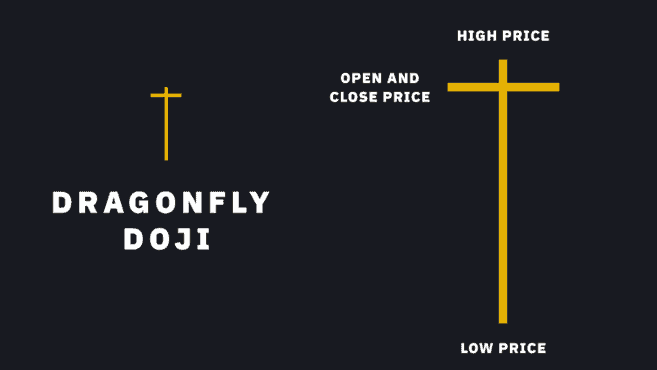
The opening and closing lines of a doji should be identically drawn in order to adhere to the symbol’s initial definition. But what happens if the open and close aren’t the same, but rather quite similar to one another? A spinning top is another name for this. On the other hand, an accurate Doji is difficult to find because to the high degree of volatility that characterizes cryptocurrency markets. As a result of this, the term “Doji” and “spinning top” are often used interchangeably.
Candlestick patterns based on price gaps
Closing thoughts
Candlestick patterns are something every trader should at least be acquainted with, even if they don’t directly include them into their trading technique. This is because candlestick patterns may be used to predict price movements.
It is vital to keep in mind that these methods do not adhere to any scientific rules or principles, despite the fact that doing market analysis with them may surely be helpful. They instead communicate and make visible the dynamics of buying and selling that eventually drive the markets.


